
Lograge is one of the all-time great Rails gems and is one of those 3-4 gems like devise, timecop or rails_admin that I typically install on every new Rails project.
So, lograge is great, but are better alternatives in 2024? I think so. We'll examine two options: an excellent free choice called Rails Semantic Logger and one I've built for the Prefab platform.
What Problem Do These Gems Solve?
First, let's take a quick look at what problem we're trying to solve. Here's the logging you get from Rails & Lograge out of the box at info level.
- Rails @ Info
- LogRage @ Info
Started GET "/posts" for 127.0.0.1 at 2023-09-06 10:08:20 -0400
Processing by PostsController#index as HTML
  Rendered posts/index.html.erb within layouts/application (Duration: 0.8ms | Allocations: 813)
  Rendered layout layouts/application.html.erb (Duration: 19.3ms | Allocations: 34468)
Completed 200 OK in 30ms (Views: 21.1ms | ActiveRecord: 0.5ms | Allocations: 45960)
method=GET path=/posts format=html controller=PostsController action=index status=200 allocations=46692 duration=32.37 view=21.32 db=0.80
There are a number of annoyances with the Rails logging defaults:
- 5 lines of logging for a single request.
- "Completed 200 OK" doesn't tell us which request it was that completed.
- No timestamps on the log lines after the first one.
In contrast, lograge is clear, concise & grep-able.
(You can, of course, output in JSON as well; I'm not showing that because it's not as pleasant to look at.)
So this is the problem that lograge has been solving all these years, and it's a great fix.
More Than Just a Single Line
But, a single-line request summary is not the only interesting aspect of logging. What about debug logging? What about tagged and struct logging? Can any of these libraries help us fix our problems faster?
To exercise the other aspects of logging, here's the sample code we will run. It logs at all four levels and uses tagged and structlog to show how to add context to your logs.
class PostsController < ApplicationController
  def index
    @posts = Post.all
    if can_use_struct_log?
      logger.debug "🍏🍏🍏detailed information", posts: @posts.size #struct logging
      logger.info "🍋🍋🍋informational logging", posts: @posts.size
    else
      logger.debug "🍏🍏🍏detailed information #{@posts.size}" # old-school
      logger.info "🍋🍋🍋informational logging #{@posts.size}"
    end
    @posts.first.process_post
  end
end

class Post < ApplicationRecord
  def process_post
    logger.tagged "process post" do
      logger.tagged "post-#{id}" do #nested tagged logging
        logger.debug "🍏🍏🍏details of the post"
        logger.info "🍋🍋🍋 info about the post"
      end
    end
  end
end
Comparing At INFO Level
Let's compare the output at the info level for each of the gems. It is a bit funky to see it on the web and not a wide terminal, but we'll do our best. Each of the gems does provide a way to provide a custom formatter to tweak things like date, time, etc, but this is what you get out of the box. Also, you'll probably want to use JSON output in production. All the gems support that; see the JSON output comparison in the appendix, but it's pretty straightforward.
- Rails @ Info
- LogRage @ Info
- SemanticRails @ Info
- Prefab @ Info
Started GET "/posts" for 127.0.0.1 at 2023-09-06 10:08:20 -0400
Processing by PostsController#index as HTML
🍋🍋🍋informational logging 1
[process post] [post-2] 🍋🍋🍋 info about the post
  Rendered posts/index.html.erb within layouts/application (Duration: 0.8ms | Allocations: 813)
  Rendered layout layouts/application.html.erb (Duration: 19.3ms | Allocations: 34468)
Completed 200 OK in 30ms (Views: 21.1ms | ActiveRecord: 0.5ms | Allocations: 45960)
We see that Rails, by default, has no support for structured logging, though it does support tagged logging. We're outputting logging 1 instead of logging posts=1 and in JSON we won't have a nice {"posts": 1} to index.
It's also not clear what class or file informational logging 1 is coming from. This is annoying because it makes us need to type more detail into the error message just to help us locate / grep.
We do see helpful logging about what templates were rendered and how long they took.
🍋🍋🍋informational logging 1
[process post] [post-2] 🍋🍋🍋 info about the post
method=GET path=/posts format=html controller=PostsController action=index status=200 allocations=46692 duration=32.37 view=21.32 db=0.80
Lograge also does not support structure logging, so no nice {"posts": 1} in our JSON.
It's also not clear where our logging is coming from because it doesn't list the class name.
Lograge has removed the template and request start logging at the info level.
2023-11-20 15:20:11.967022 I [16169:puma srv tp 002] PostsController -- 🍋🍋🍋informational logging -- { :posts => 1 }
2023-11-20 15:20:11.972477 I [16169:puma srv tp 002] [process post] [post-2] Post -- 🍋🍋🍋 info about the post
2023-11-20 15:20:11.996946 I [16169:puma srv tp 002] (32.8ms) PostsController -- Completed #index -- { :controller => "PostsController", :action => "index", :format => "HTML", :method => "GET", :path => "/", :status => 200, :view_runtime => 21.93, :db_runtime => 0.51, :allocations => 48567, :status_message => "OK" }
At the info level, we can start to see what SemanticRails brings to the table. The big help is that we're also outputting the class names: PostsController and Post which helps us orient about where these messages are coming from.
We can see the { :posts => 1 } from our structured logging as well as the [process post] and [post-2]` tags, and we can see the single-line request summary at the end.
If you notice in the Rails logs, there is information about what templates were rendered. SemanticRails has reclassified this info logging to only output at the debug level.
INFO  Started GET "/" for ::1 at 2023-11-20 15:04:07 -0500 path=rails.rack.logger.call_app
INFO  Processing by PostsController#index as HTML path=active_support.log_subscriber.info
INFO  🍋🍋🍋informational logging path=app.controllers.posts_controller.index posts=1
INFO  🍋🍋🍋 info about the post log.tags=["process post", "post-2"] path=app.models.post.process_post
INFO  Rendered posts/index.html.erb within layouts/application (Duration: 1.8ms | Allocations: 1516) path=active_support.log_subscriber.info
INFO  Rendered layout layouts/application.html.erb (Duration: 24.8ms | Allocations: 35463) path=active_support.log_subscriber.info
INFO  Completed 200 OK in 42ms (Views: 26.7ms | ActiveRecord: 0.6ms | Allocations: 52173) path=active_support.log_subscriber.info
INFO  200 PostsController#index action=index controller=PostsController db_runtime=0.62 format=html method=GET path=rails.controller.request req_path=/ status=200 view_runtime=26.72
Like SemanticRails, Prefab supports structured logging and adds the path to the log line: 🍋🍋🍋 informational logging path=app.controllers.posts_controller.index posts=1.
Prefab also adds a helpful single-line summary of the request.
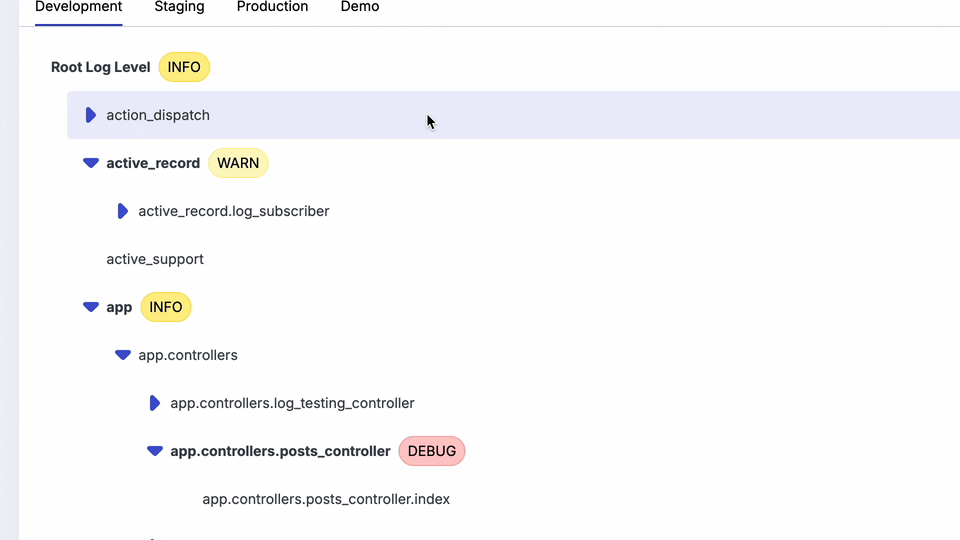
Prefab has not removed the layout rendering and other request logging. Prefab's philosophy is that it should output all the logs but give you easy ways to turn them on and off. You can quickly turn logs on and off via the UI in any environment:
Comparing At DEBUG Level
For completeness, let's compare the output at the debug level for each of the gems.
- Rails @ Debug
- LogRage @ Debug
- SemanticRails @ Debug
- Prefab @ Debug
Started GET "/posts" for 127.0.0.1 at 2023-09-06 10:01:55 -0400
Processing by PostsController#index as HTML
  Post Count (0.0ms)  SELECT COUNT(*) FROM "posts"
  ↳ app/controllers/posts_controller.rb:8:in `index'
🍏🍏🍏detailed information 1
  CACHE Post Count (0.0ms)  SELECT COUNT(*) FROM "posts"
  ↳ app/controllers/posts_controller.rb:9:in `index'
🍋🍋🍋informational logging 1
  CACHE Post Count (0.0ms)  SELECT COUNT(*) FROM "posts"
  ↳ app/controllers/posts_controller.rb:10:in `index'
  CACHE Post Count (0.0ms)  SELECT COUNT(*) FROM "posts"
  ↳ app/controllers/posts_controller.rb:11:in `index'
  Post Exists? (0.1ms)  SELECT 1 AS one FROM "posts" LIMIT ?  [["LIMIT", 1]]
  ↳ app/controllers/posts_controller.rb:12:in `index'
  Post Load (0.0ms)  SELECT "posts".* FROM "posts" ORDER BY "posts"."id" ASC LIMIT ?  [["LIMIT", 1]]
  ↳ app/controllers/posts_controller.rb:13:in `index'
[process post] [post-2] 🍏🍏🍏details of the post
[process post] [post-2] 🍋🍋🍋 info about the post
  Rendering layout layouts/application.html.erb
  Rendering posts/index.html.erb within layouts/application
  Post Load (0.1ms)  SELECT "posts".* FROM "posts"
  ↳ app/views/posts/index.html.erb:4
  Rendered posts/index.html.erb within layouts/application (Duration: 0.6ms | Allocations: 736)
  Rendered layout layouts/application.html.erb (Duration: 7.9ms | Allocations: 14135)
Completed 200 OK in 15ms (Views: 8.4ms | ActiveRecord: 0.6ms | Allocations: 20962)
Rails debug for local dev gets pretty chatty with a lot more detail. In addition to the templates and layouts we got at the debug level, we can now see the executed SQL.
We also now get class and line number output for some of the logging, though not all of it. Our custom logging does not include any information about where it came from.
It's also a lot of output, and it's not particularly easy to grep for the important bits. As your app grows, this logging can start to get a bit overwhelming.
It may go without saying, but turning this on in production would be a very bad idea.
Post Count (0.3ms)  SELECT COUNT(*) FROM "posts"
  ↳ app/controllers/posts_controller.rb:8:in `index'
🍏🍏🍏detailed information 1
  CACHE Post Count (0.0ms)  SELECT COUNT(*) FROM "posts"
  ↳ app/controllers/posts_controller.rb:9:in `index'
🍋🍋🍋informational logging 1
  CACHE Post Count (0.0ms)  SELECT COUNT(*) FROM "posts"
  ↳ app/controllers/posts_controller.rb:10:in `index'
  CACHE Post Count (0.0ms)  SELECT COUNT(*) FROM "posts"
  ↳ app/controllers/posts_controller.rb:11:in `index'
  Post Exists? (0.1ms)  SELECT 1 AS one FROM "posts" LIMIT ?  [["LIMIT", 1]]
  ↳ app/controllers/posts_controller.rb:12:in `index'
  Post Load (0.0ms)  SELECT "posts".* FROM "posts" ORDER BY "posts"."id" ASC LIMIT ?  [["LIMIT", 1]]
  ↳ app/controllers/posts_controller.rb:13:in `index'
[process post] [post-2] 🍏🍏🍏details of the post
[process post] [post-2] 🍋🍋🍋 info about the post
  Post Load (0.1ms)  SELECT "posts".* FROM "posts"
  ↳ app/views/posts/index.html.erb:4
method=GET path=/posts format=html controller=PostsController action=index status=200 allocations=49556 duration=33.84 view=22.60 db=0.73
Lograge is pretty much the same as the Rails logger when it comes to debugging. Lograge's approach is to help you solve logging in production, so it leans on the existing Rails formatting for local dev.
2023-11-20 15:28:07.318919 D [16770:puma srv tp 003 remote_ip.rb:93] Rack -- Started -- { :method => "GET", :path => "/", :ip => "::1" }
2023-11-20 15:28:07.336737 D [16770:puma srv tp 003] (0.072ms) ActiveRecord -- ActiveRecord::SchemaMigration Pluck -- { :sql => "SELECT \"schema_migrations\".\"version\" FROM \"schema_migrations\" ORDER BY \"schema_migrations\".\"version\" ASC", :allocations => 39, :cached => nil }
2023-11-20 15:28:07.350951 D [16770:puma srv tp 003 subscriber.rb:149] PostsController -- Processing #index
2023-11-20 15:28:07.355143 D [16770:puma srv tp 003 posts_controller.rb:5] (0.262ms) ActiveRecord -- Post Count -- { :sql => "SELECT COUNT(*) FROM \"posts\"", :allocations => 21, :cached => nil }
2023-11-20 15:28:07.355179 D [16770:puma srv tp 003 posts_controller.rb:5] PostsController -- 🍏🍏🍏detailed information -- { :posts => 1 }
2023-11-20 15:28:07.355336 D [16770:puma srv tp 003 posts_controller.rb:6] (0.004ms) ActiveRecord -- Post Count -- { :sql => "SELECT COUNT(*) FROM \"posts\"", :allocations => 3, :cached => true }
2023-11-20 15:28:07.355346 I [16770:puma srv tp 003 posts_controller.rb:6] PostsController -- 🍋🍋🍋informational logging -- { :posts => 1 }
2023-11-20 15:28:07.355459 D [16770:puma srv tp 003 posts_controller.rb:7] (0.004ms) ActiveRecord -- Post Count -- { :sql => "SELECT COUNT(*) FROM \"posts\"", :allocations => 3, :cached => true }
2023-11-20 15:28:07.355604 D [16770:puma srv tp 003 posts_controller.rb:8] (0.004ms) ActiveRecord -- Post Count -- { :sql => "SELECT COUNT(*) FROM \"posts\"", :allocations => 3, :cached => true }
2023-11-20 15:28:07.356317 D [16770:puma srv tp 003 posts_controller.rb:16] (0.061ms) ActiveRecord -- Post Exists? -- { :sql => "SELECT 1 AS one FROM \"posts\" LIMIT ?", :binds => { :limit => 1 }, :allocations => 28, :cached => nil }
2023-11-20 15:28:07.357050 D [16770:puma srv tp 003 posts_controller.rb:17] (0.045ms) ActiveRecord -- Post Load -- { :sql => "SELECT \"posts\".* FROM \"posts\" ORDER BY \"posts\".\"id\" ASC LIMIT ?", :binds => { :limit => 1 }, :allocations => 57, :cached => nil }
2023-11-20 15:28:07.360796 D [16770:puma srv tp 003 post.rb:19] [process post] [post-2] Post -- 🍏🍏🍏details of the post
2023-11-20 15:28:07.360853 I [16770:puma srv tp 003 post.rb:20] [process post] [post-2] Post -- 🍋🍋🍋 info about the post
2023-11-20 15:28:07.365288 D [16770:puma srv tp 003 fanout.rb:207] ActionView -- Rendering -- { :template => "posts/index.html.erb" }
2023-11-20 15:28:07.366600 D [16770:puma srv tp 003 index.html.erb:4] (0.108ms) ActiveRecord -- Post Load -- { :sql => "SELECT \"posts\".* FROM \"posts\"", :allocations => 57, :cached => nil }
2023-11-20 15:28:07.366907 D [16770:puma srv tp 003 subscriber.rb:149] (1.513ms) ActionView -- Rendered -- { :template => "posts/index.html.erb", :within => "layouts/application", :allocations => 1101 }
2023-11-20 15:28:07.396876 I [16770:puma srv tp 003 subscriber.rb:149] (45.8ms) PostsController -- Completed #index -- { :controller => "PostsController", :action => "index", :format => "HTML", :method => "GET", :path => "/", :status => 200, :view_runtime => 32.75, :db_runtime => 0.75, :allocations => 51109, :status_message => "OK" }
At the debug level, SemanticRails really starts to show off. It does a nice job of doing structured logging for ActiveRecord loads: ActiveRecord -- Post Load -- { :sql => "SELECT \"posts\".* FROM \"posts\"", :allocations => 57, :cached => nil }.
This structure helps you grep and search through the log lines. You also have a ton of options for getting the logging just the way you like it. https://logger.rocketjob.io/rails.html has a lot more details.
I also turned on config.semantic_logger.backtrace_level = :debug, which lets us even see the file and line number like posts_controller.rb:8 or fanout.rb:207.
INFO Started GET "/" for ::1 at 2023-11-20 15:04:07 -0500 path=rails.rack.logger.call_app
INFO Processing by PostsController#index as HTML path=active_support.log_subscriber.info
DEBUG Post Count (0.0ms) SELECT COUNT(*) FROM "posts" path=active_support.log_subscriber.debug
DEBUG ↳ app/controllers/posts_controller.rb:5:in `index' path=active_record.log_subscriber.log_query_source
DEBUG 🍏🍏🍏detailed information path=app.controllers.posts_controller.index posts=1
DEBUG CACHE Post Count (0.0ms) SELECT COUNT(*) FROM "posts" path=active_support.log_subscriber.debug
DEBUG ↳ app/controllers/posts_controller.rb:6:in `index' path=active_record.log_subscriber.log_query_source
INFO 🍋�🍋🍋informational logging path=app.controllers.posts_controller.index posts=1
DEBUG CACHE Post Count (0.0ms) SELECT COUNT(*) FROM "posts" path=active_support.log_subscriber.debug
DEBUG ↳ app/controllers/posts_controller.rb:7:in `index' path=active_record.log_subscriber.log_query_source
DEBUG CACHE Post Count (0.0ms) SELECT COUNT(*) FROM "posts" path=active_support.log_subscriber.debug
DEBUG ↳ app/controllers/posts_controller.rb:8:in `index' path=active_record.log_subscriber.log_query_source
DEBUG Post Exists? (0.1ms) SELECT 1 AS one FROM "posts" LIMIT ? [["LIMIT", 1]] path=active_support.log_subscriber.debug
DEBUG ↳ app/controllers/posts_controller.rb:16:in `index' path=active_record.log_subscriber.log_query_source
DEBUG Post Load (0.1ms) SELECT "posts".* FROM "posts" ORDER BY "posts"."id" ASC LIMIT ? [["LIMIT", 1]] path=active_support.log_subscriber.debug
DEBUG ↳ app/controllers/posts_controller.rb:17:in `index' path=active_record.log_subscriber.log_query_source
DEBUG 🍏🍏🍏details of the post log.tags=["process post", "post-2"] path=app.models.post.process_post
INFO 🍋🍋🍋 info about the post log.tags=["process post", "post-2"] path=app.models.post.process_post
DEBUG Rendering layout layouts/application.html.erb path=active_support.log_subscriber.debug
DEBUG Rendering posts/index.html.erb within layouts/application path=active_support.log_subscriber.debug
DEBUG Post Load (0.1ms) SELECT "posts".* FROM "posts" path=active_support.log_subscriber.debug
DEBUG ↳ app/views/posts/index.html.erb:4 path=active_record.log_subscriber.log_query_source
INFO Rendered posts/index.html.erb within layouts/application (Duration: 1.8ms | Allocations: 1516) path=active_support.log_subscriber.info
INFO Rendered layout layouts/application.html.erb (Duration: 24.8ms | Allocations: 35463) path=active_support.log_subscriber.info
INFO Completed 200 OK in 42ms (Views: 26.7ms | ActiveRecord: 0.6ms | Allocations: 52173) path=active_support.log_subscriber.info
INFO 200 PostsController#index action=index controller=PostsController db_runtime=0.62 format=html method=GET path=rails.controller.request req_path=/ status=200 view_runtime=26.72
Prefab aims for a middle road of readability/complexity.
Instead of fine-tuning your output by changing a configuration file. Prefab's has a UI to toggle on things like the template messages or active record SQl, so that you can see it only when you need it. The fun bit is that you can also do this in staging or production. Read more about dynamic log levels.
You can also target this verbose logging like you would a feature flag so that it's only on for a particular user or transaction that is causing issues.
This is a big deal, because it means you can now turn on debugging on in production. You can't realistically do that with the other gems. The key is the targeting. We still won't turn on ALL debugging, but with rules we can just turn it on for a particular class, or go even more specific by turning on debug logging for a particular user for 5 minutes and you may be able to debug your issues without having to redeploy.
JSON Formatting
The JSON formatting of each of these libraries is pretty much what you would expect, but for completeness:
- LogRage JSON
- SemanticRails JSON
- Prefab JSON
{
  "method":"GET",
  "path":"/posts",
  "format":"html",
  "controller":"PostsController",
  "action":"index",
  "status":200,
  "allocations":45961,
  "duration":37.91,
  "view":29.63,
  "db":0.42
}
{
  "host":"My-MacBook-Pro.local",
  "application":"Semantic Logger",
  "environment":"development",
  "timestamp":"2023-09-06T14:18:33.507019Z",
  "level":"info",
  "level_index":2,
  "pid":67151,
  "thread":"puma srv tp 001",
  "file":"/Users/me/RubymineProjects/RailsLoggingTestApplication/app/models/post.rb",
  "line":17,
  "tags":["process post", "post-2"],
  "name":"Post",
  "message":"🍋🍋🍋 info about the post"
}
{
  "severity":"INFO",
  "datetime":"2023-11-20T13:15:47.502-05:00",
  "path":"app.models.post.process_post",
  "message":"🍋🍋🍋 info about the post ",
  "log.tags":["process post", "post-2"]
}
Summary
The state of Rails logging gems in 2024 is good, and you've got great options. If you've been defaulting to just standard Rails logging or lograge for years, it may be time to take a look at what else is out there. Being able to quickly trace each log line back to its source is valuable, and structured logging feels much better than string interpolation and can be very powerful in conjunction with your log aggregation tool.
Rails Default Logger
Good:
- Rails gives us a lot of great information out of the box.
Bad:
- 5 lines of logging for a single request is too much in deployed environments.
- "Completed 200 OK" doesn't tell us what request completed.
- No timestamps on the log lines after the first one.
- Difficult to fine-tune debug logging. Very "all-or-nothing".
Lograge
Lograge has been the default choice for years. If you don't use much logging and just want the basic request log, it's a good choice.
For more information, check out the GitHub for lograge
Good
- Better 1-line Req Log
- Supports tagged logging
Bad
- No support for struct log
- Unclear display of level by default formatter
- Difficult to fine-tune debug logging
- Doesn’t format your other logs, like
Rails.logger.info "foo" - No file names/origin of logging
rails_semantic_logger
Rails Semantic Logger is an impressive piece of software that has been around for a long time. It's got a lot of features and is very configurable. It has everything you could want in a logger, save the ability to update it dynamically.
For more information, check out the docs for rails_semantic_logger
Good:
- Adds Class Name
- Optionally add file and line number
- Better 1-line Req Log
- Very configurable
- Structlog & Tagged Logging
logger.measure_trace("Low level trace information such as data sent over a socket") do ... endis coollogger.error("Oops external call failed", exception)is cool
Bad:
- Can't change log levels on the fly
prefab-cloud-ruby
Prefab is a SaaS that provides dynamic configuration and uses that to support Feature Flag and Dynamic Log Levels. Prefab provides the same log cleanup and core features as SemanticRails, with the additional benefit of being able to quickly debug production by temporarily enabling debug logging for a specific user or job.
For more information, check out: Dynamic Log Levels
Good
- Consistent display of class and method
- Change log level instantly
- Turn debugging logging on for just a single user or team
- Better 1-line Req Log
- Structlog & Tagged Logging
Bad
- Not as comprehensive as rails_semantic_logger
- Fewer integrations than rails_semantic_logger or lograge
- Part of a paid product
Thanks for checking this out. If you have any questions, please reach out.